How content design unlocked £7 million in refunds
A secure service that brought three fragmented data sources together and helped thousands of public servants correct their tax position.
- Client
- HMRC
- Role
- Sole Content Designer
- Year
- 2022–2024
£7m returned to public servants
01
Three fragmented data sources
Following a court ruling, thousands of public service pension members were left unable to correct their past tax records. The core problem was that the necessary data was fragmented across three sources: the user, their pension scheme, and HMRC.
No single party had all the information required to perform the calculation. This created a frustrating deadlock, leaving users stuck, uncertain of their financial position, and unable to find out if they owed tax or were due a refund.
02
Building trust in a complex calculation
We needed a secure service that helped users gather scattered data from three different sources. It had to guide them through a complex calculation and provide a clear, trusted outcome on whether they were owed a refund or needed to pay additional tax.
03
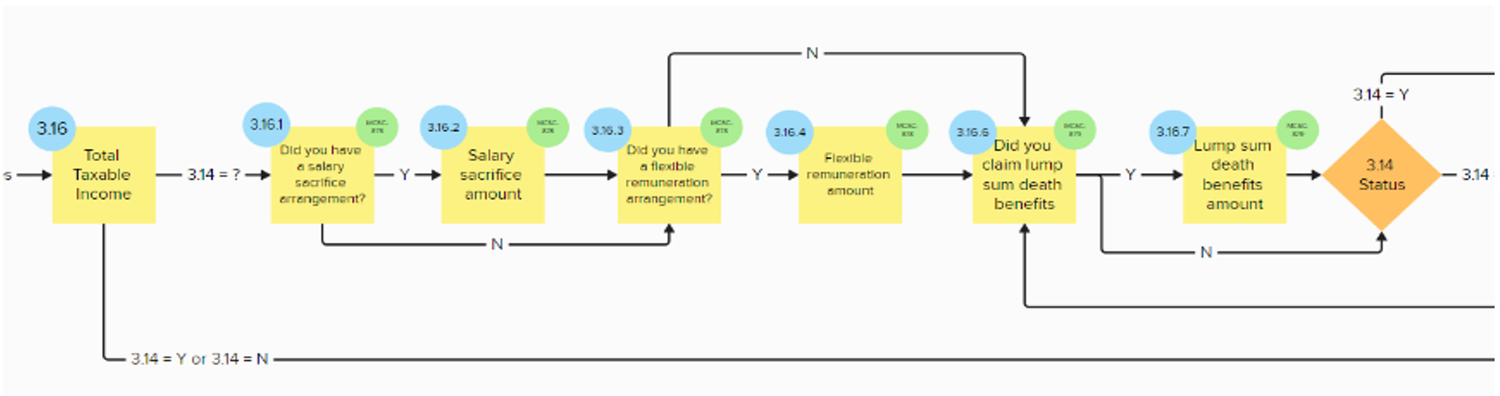
Sole content strategy for 200+ screens
I was the bridge between tax policy experts and confused users. I defined the language and information architecture, deciding exactly what to show users — and when — to guide them through a high-stress journey.
04
Translating tax law into plain English
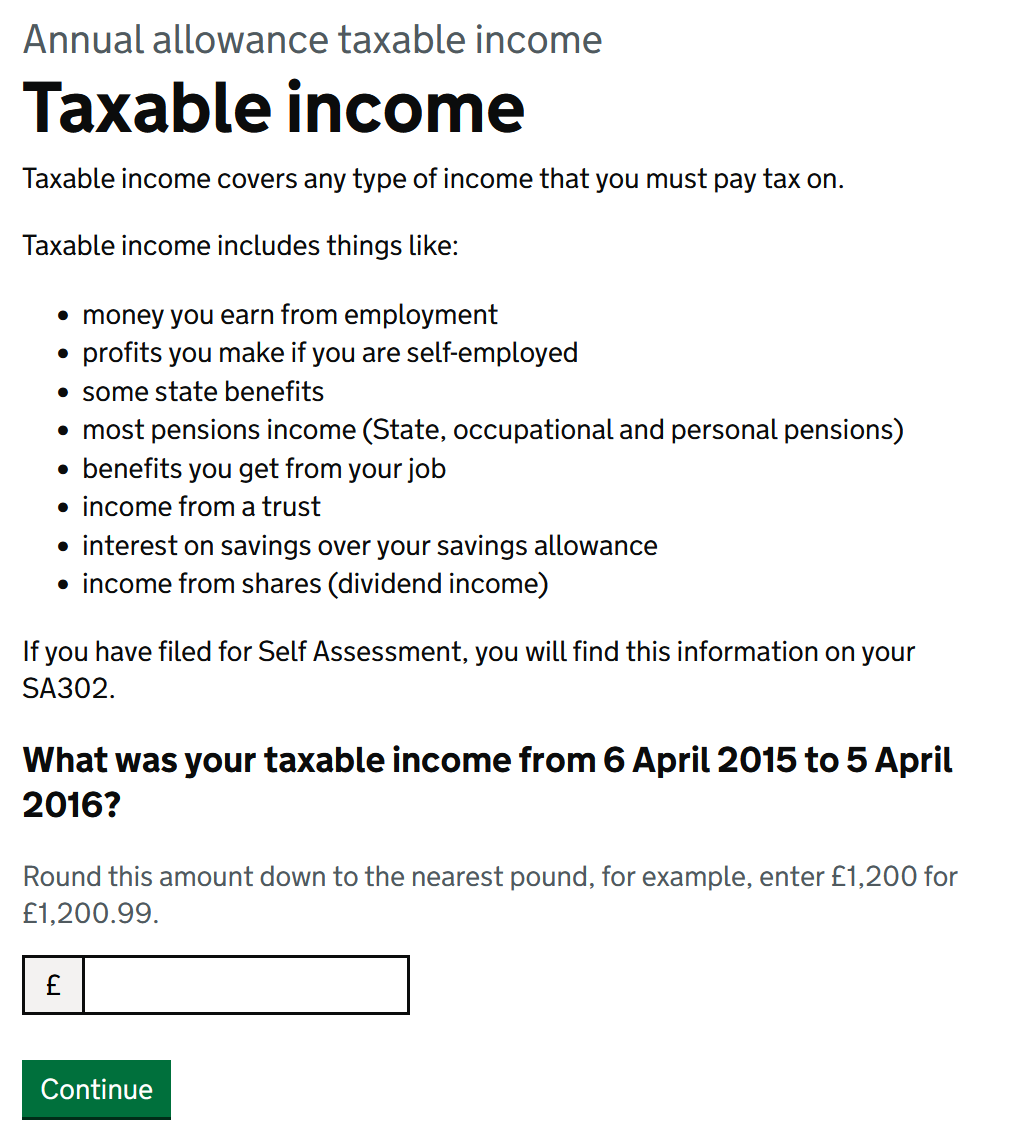
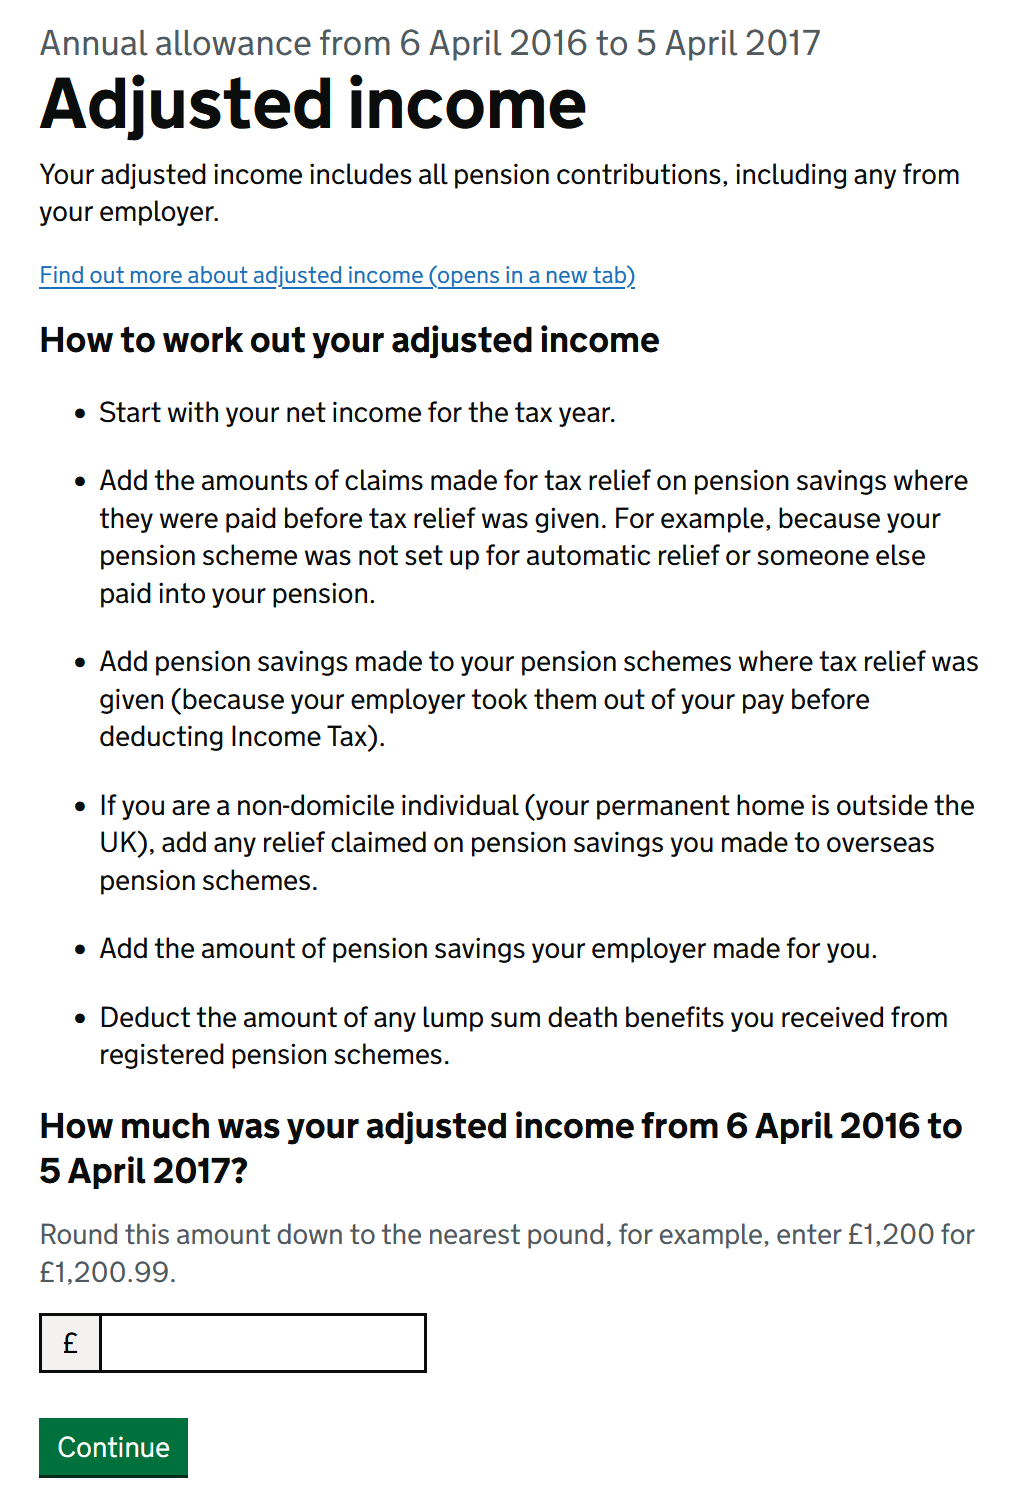
Tax calculations are inherently confusing. Our initial user testing revealed that technical language and dense numerical data were significant barriers to comprehension.
- Removing the jargonI translated complex tax terminology into plain English, consistently testing to maintain a low reading age and ensure clarity.
- Partnering with policyI worked closely with accountants and tax specialists to understand how they explain difficult concepts, then adapted those analogies for a digital format.
- Testing for confidenceWe didn’t just measure whether users could finish. We iterated the result screen until “Are you sure?” became “Okay, that makes sense.”
05
The breakthrough: from numbers to narrative
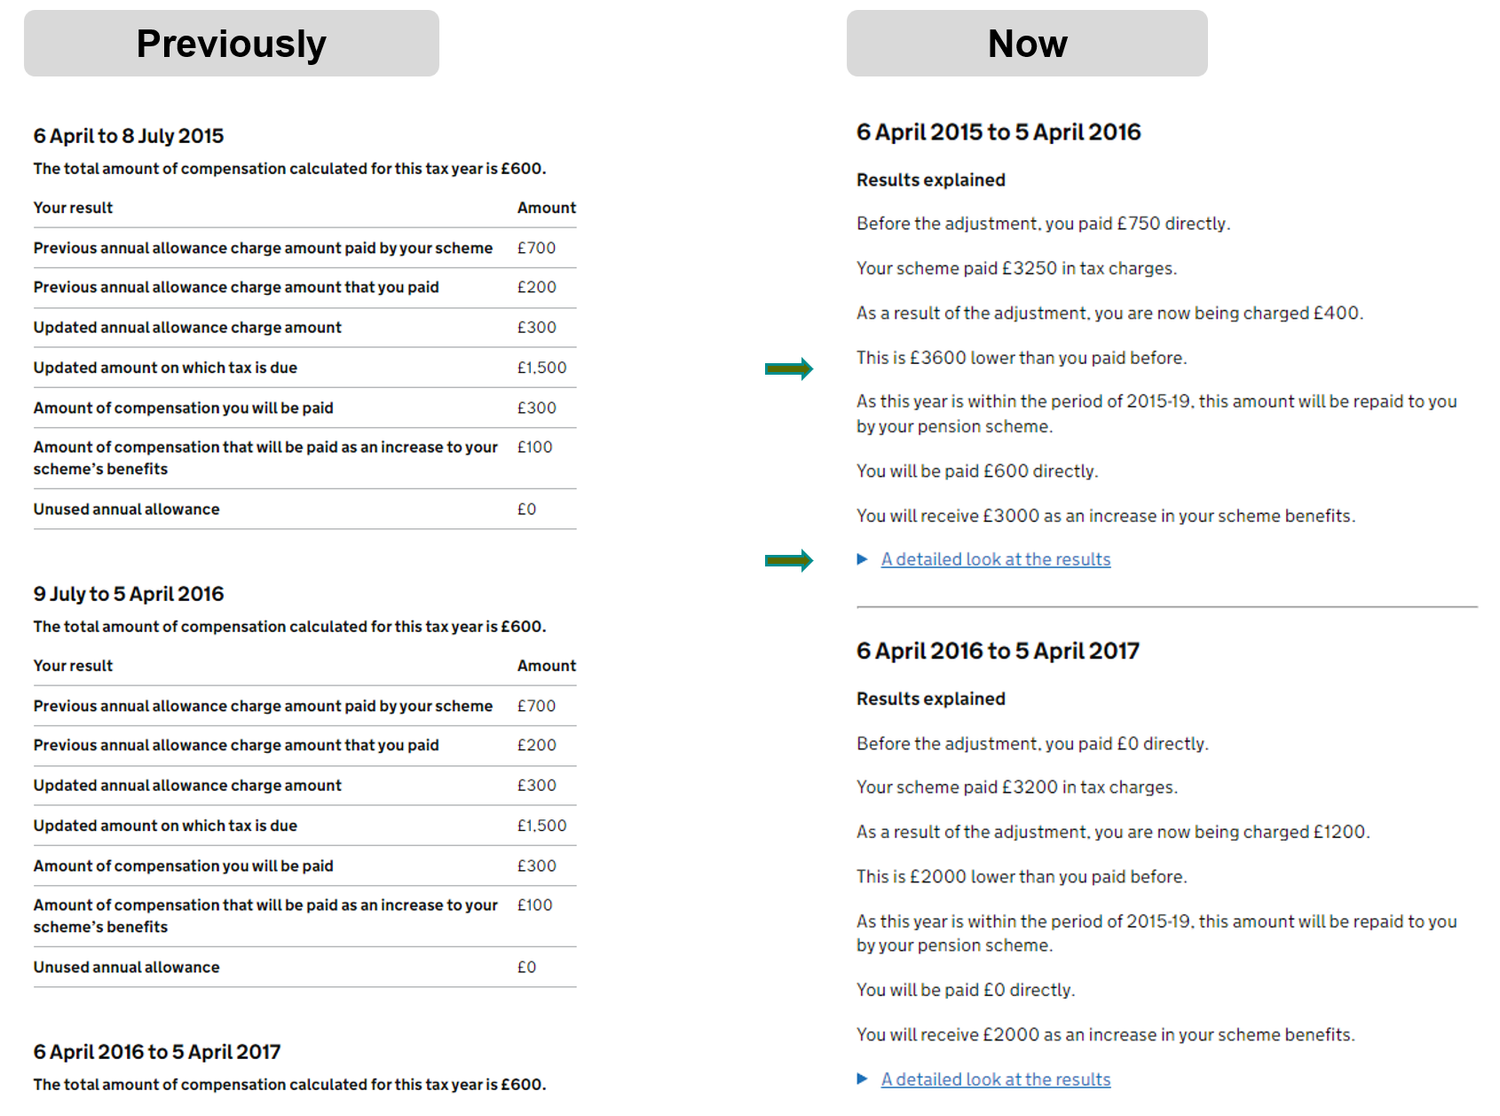
In early testing, users froze when they saw the wall of numbers in the calculation breakdown. By moving to a narrative, we turned a black-box calculation into a transparent explanation.
- A calculation storyInstead of showing a wall of numbers, I designed a step-by-step summary that explained what each number meant and why it was being used.
- Structured for clarityThe narrative transformed a daunting calculation into a clear, trustworthy explanation. In testing, it dramatically improved comprehension and confidence.
06
£7 million returned to users in year one
The service launched successfully, solving a deadlock that had affected thousands.
- 10,000+ users corrected their tax position.
- £7,000 average refund per person.
- £7 million returned to public servants.