Making tax obligations understandable
I worked on Tide’s Making Tax Digital experience, helping members understand what they needed to send to HMRC, how their figures were calculated and what happened after they sent an update.
- Client
- Tide
- Role
- Senior UX Writer
- Scope
- Setup, quarterly updates, submission, tax estimates and recovery across web and mobile
- Working with
- Product design, engineering, tax and compliance, operations, product and commercial
01
The problem
Tide was building a way for members to manage Making Tax Digital within its banking and accounting product. They needed to connect to HMRC, review their business figures and send quarterly updates.
There was a lot to explain. Members needed to know how a quarterly update differed from their annual tax return, what the figures meant and whether their update had actually gone through.
I owned the interface copy and worked with the product designer on terminology, hierarchy, statuses and recovery. Across the journey, I wanted members to understand where they were, what they’d done and what they needed to do next.
02
Making the different tasks clear
Connecting to HMRC, linking a business and sending an update were separate steps. The content needed to make those differences clear so members knew what they’d completed.
I kept “quarterly updates” separate from the annual tax return and used “tax estimate” for the amount members might owe. These distinctions carried through the instructions, actions and status messages. The annual return itself was outside the scope of this work.
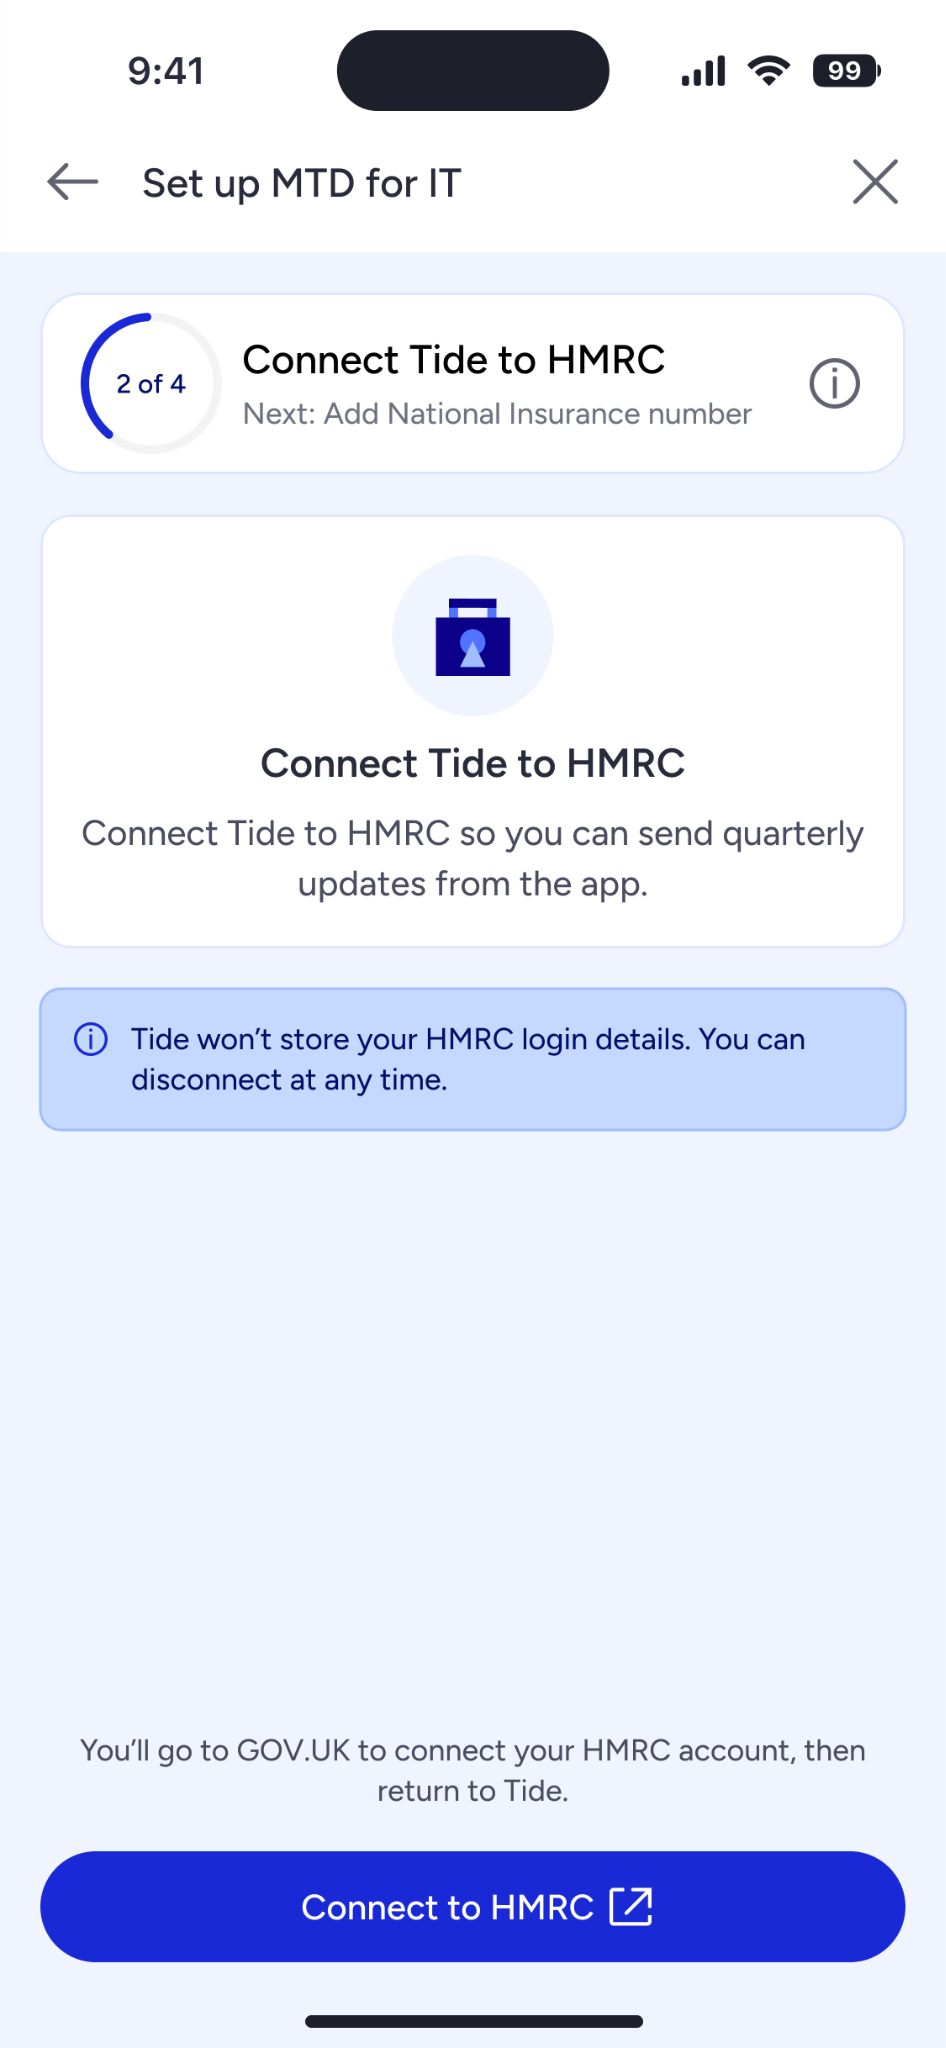
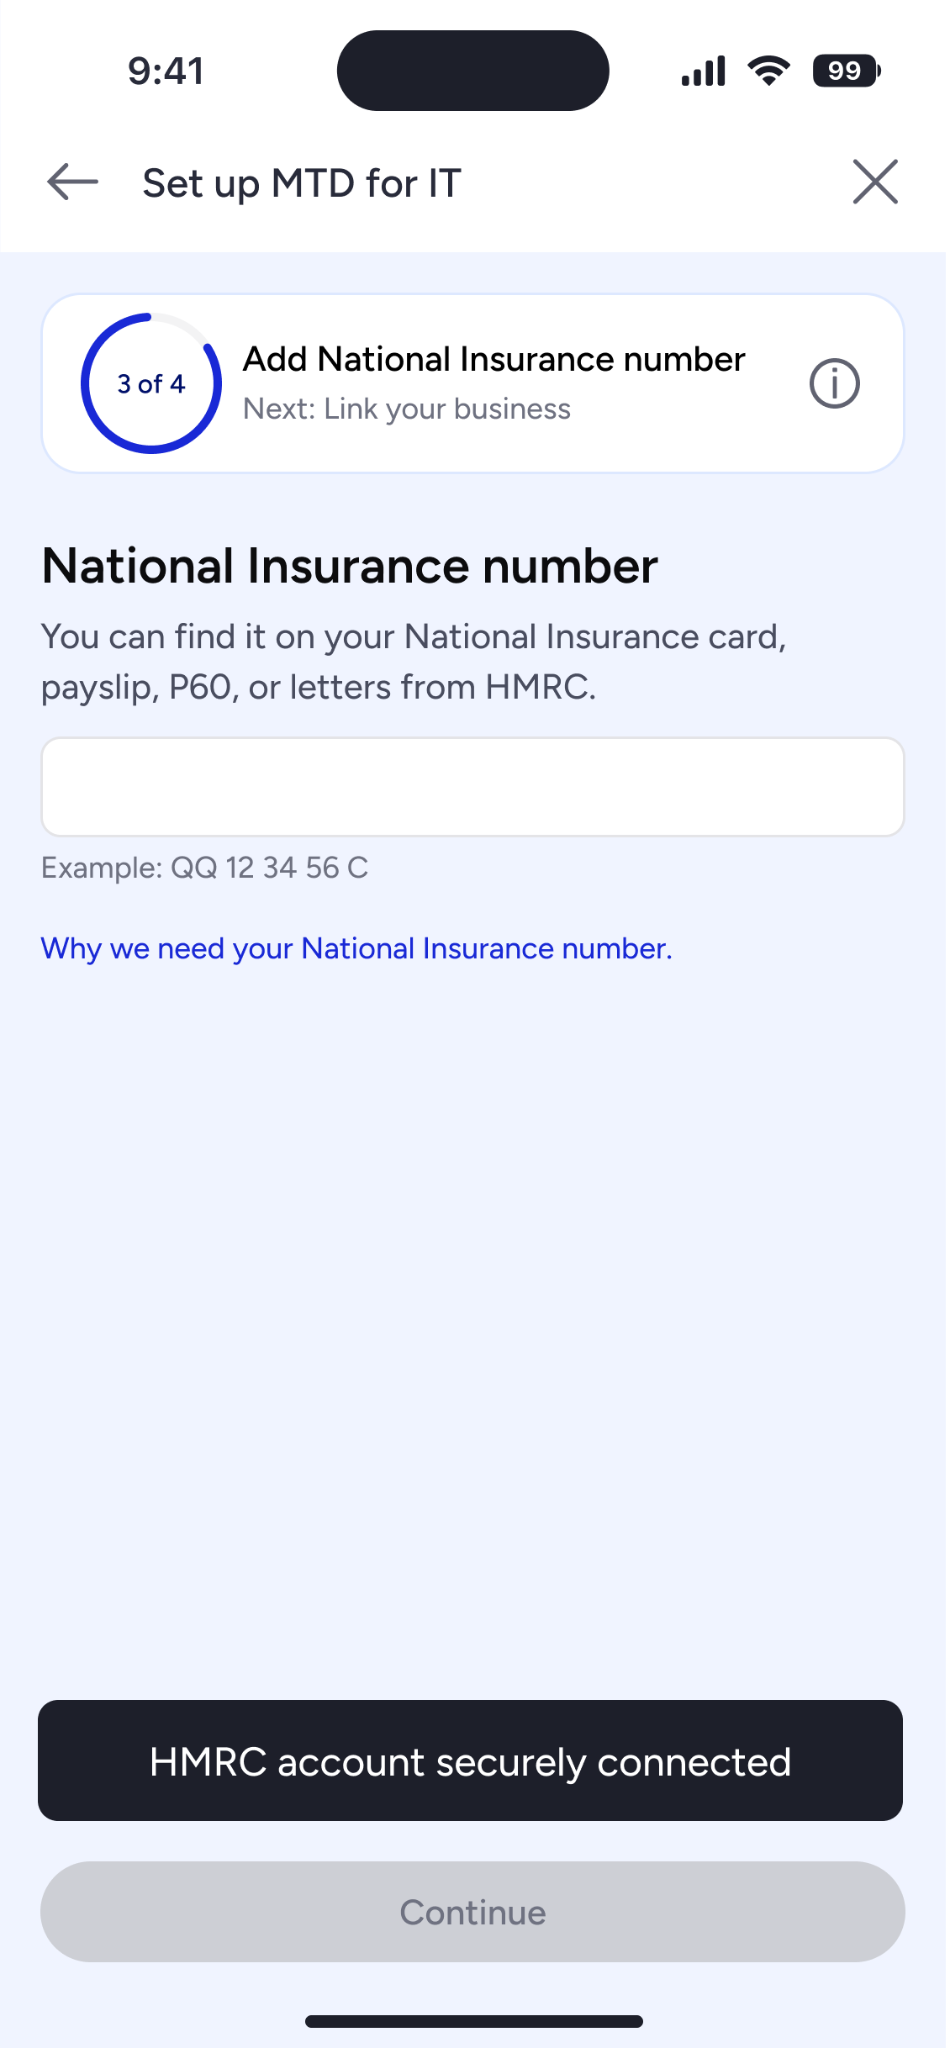
Setup also meant moving between Tide and GOV.UK. I worked on the content around that handoff, explaining why members needed to leave Tide, what to do on GOV.UK and how they’d return. This included login handling, National Insurance verification and guidance on the next step.
03
Helping members make sense of the figures
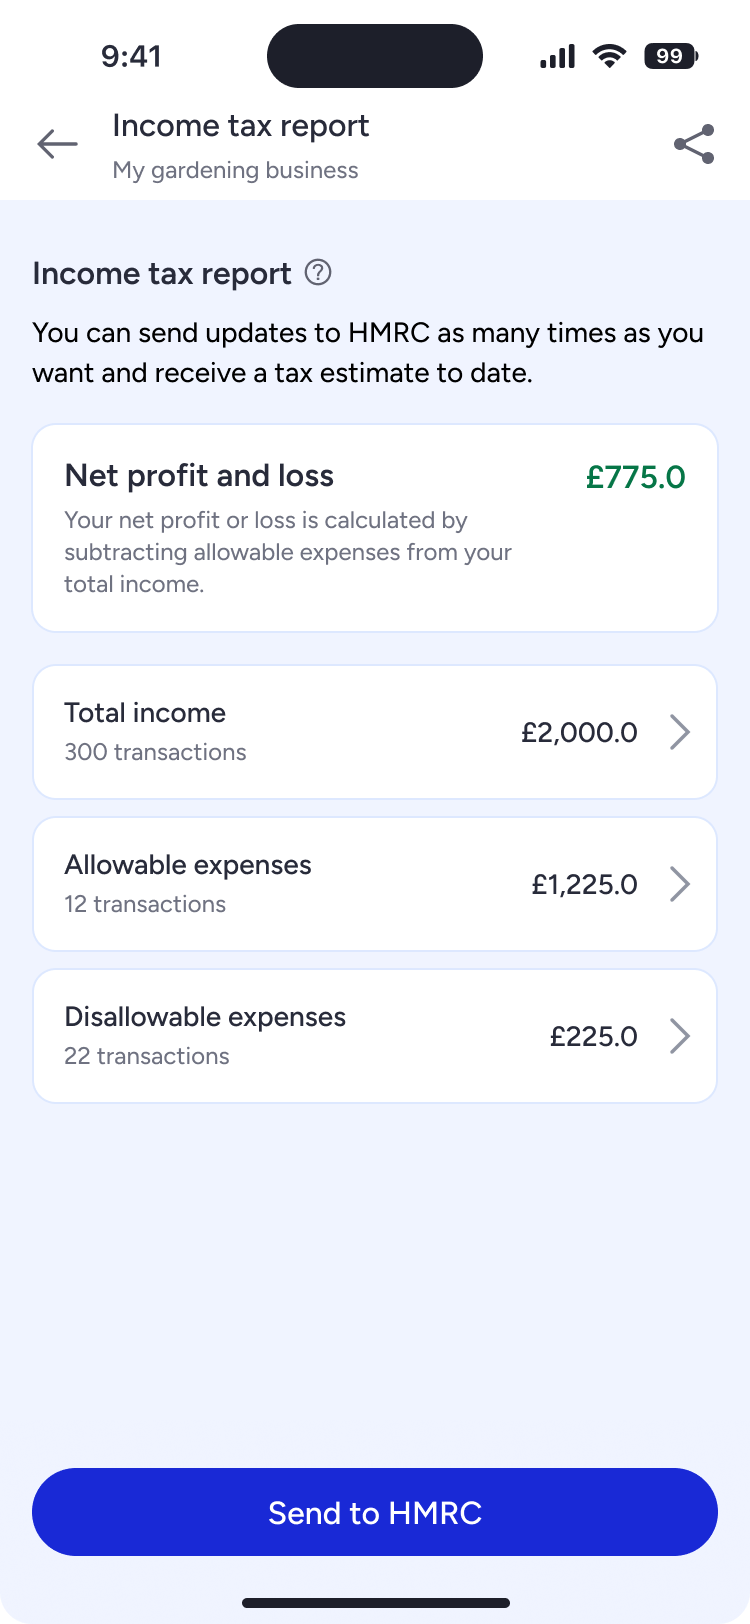
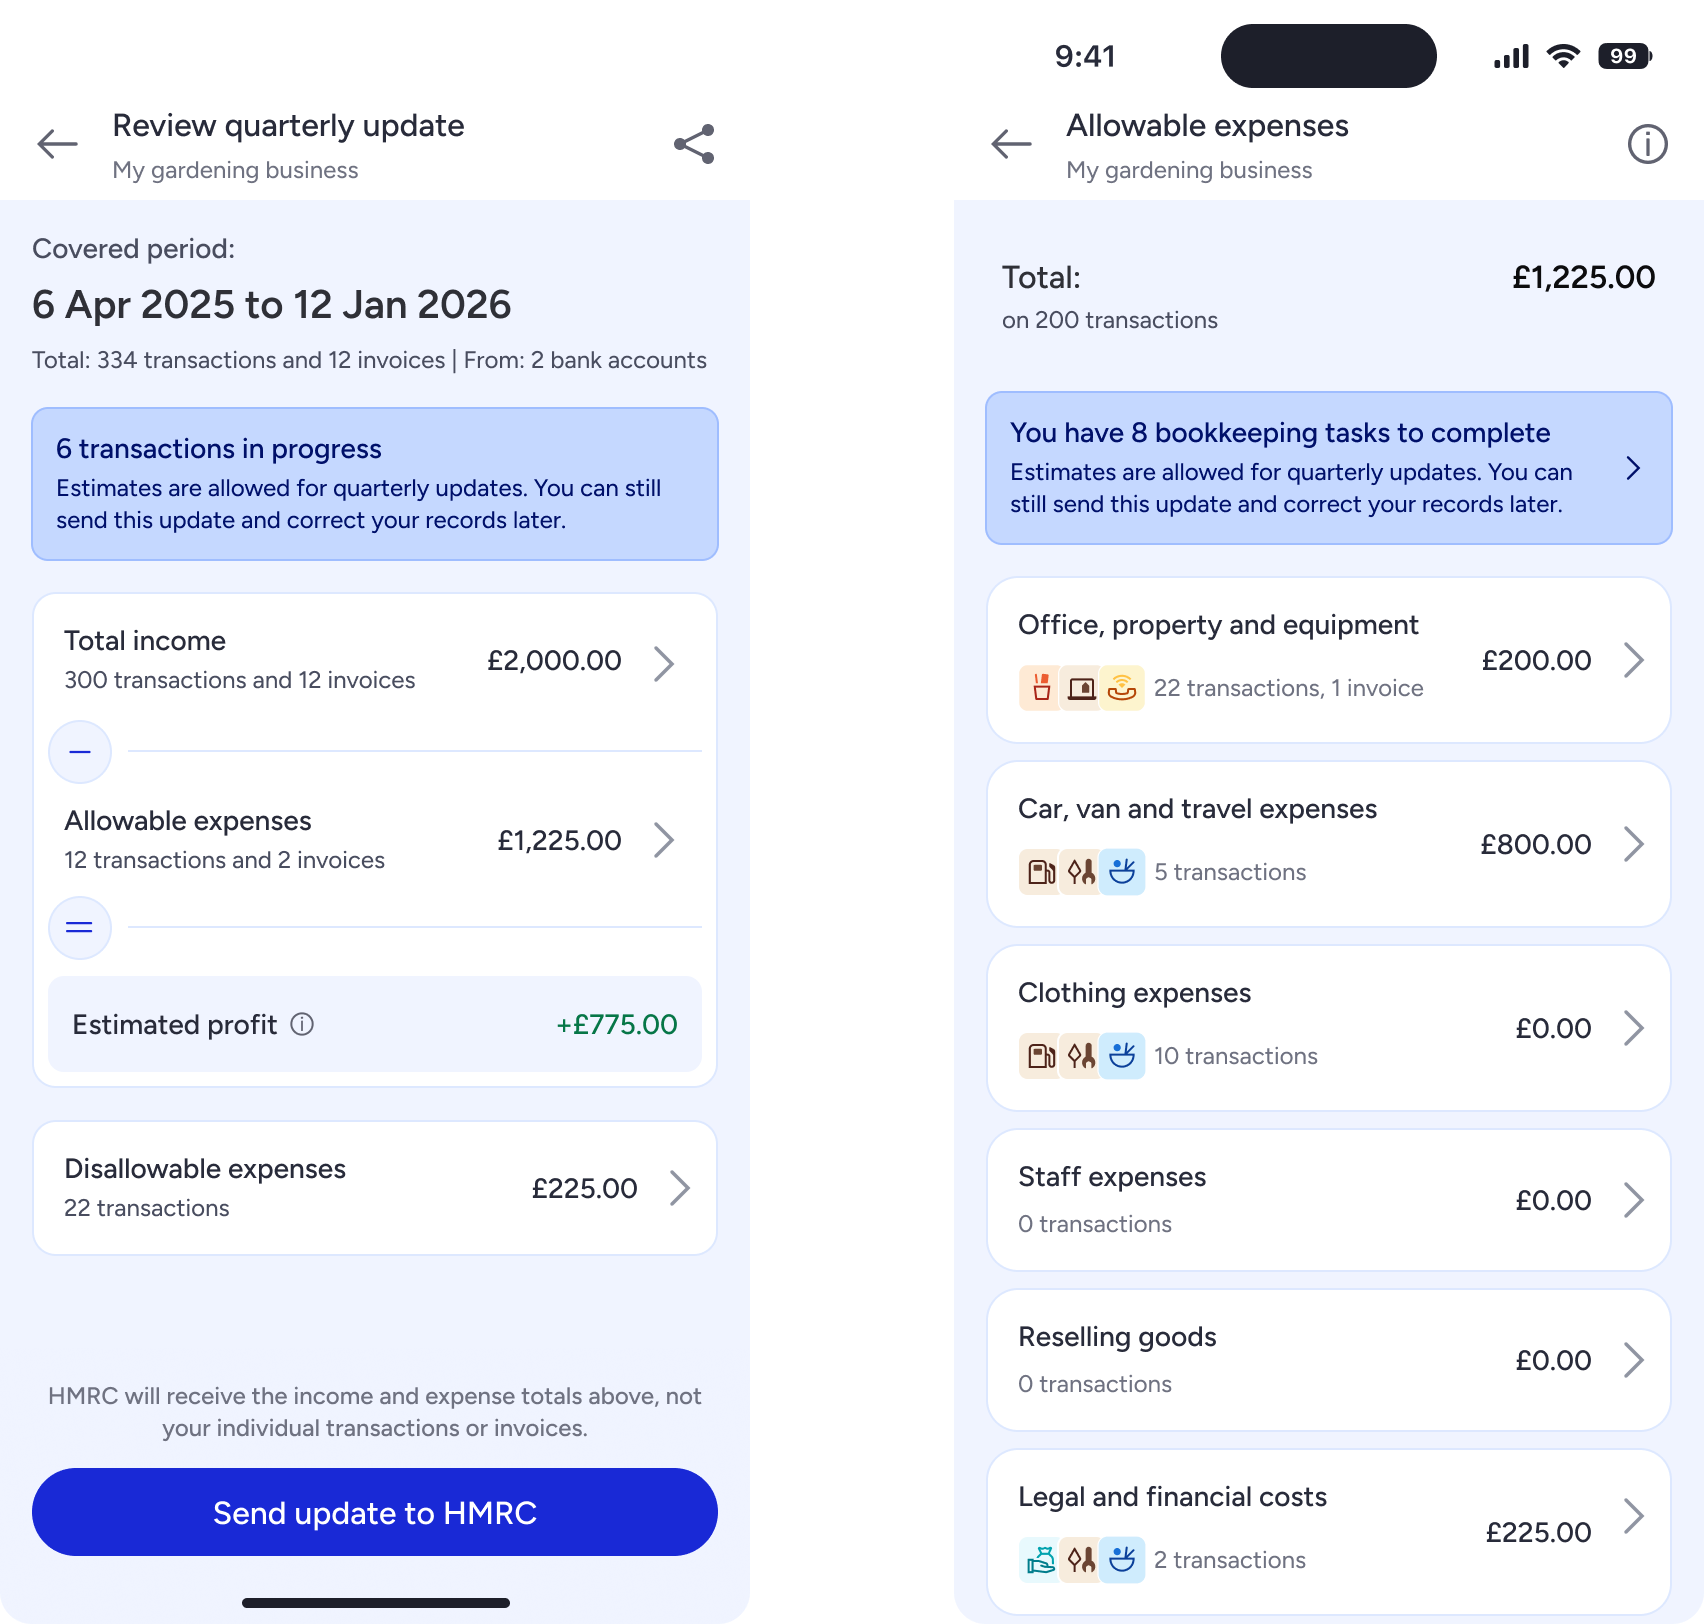
Research showed that members weren’t confident about how their income and expenses related to the tax they might owe.
We tried a detailed breakdown, then a shorter written summary. Confidence was still low. Making the explanation shorter hadn’t made the relationship between the figures clear enough.
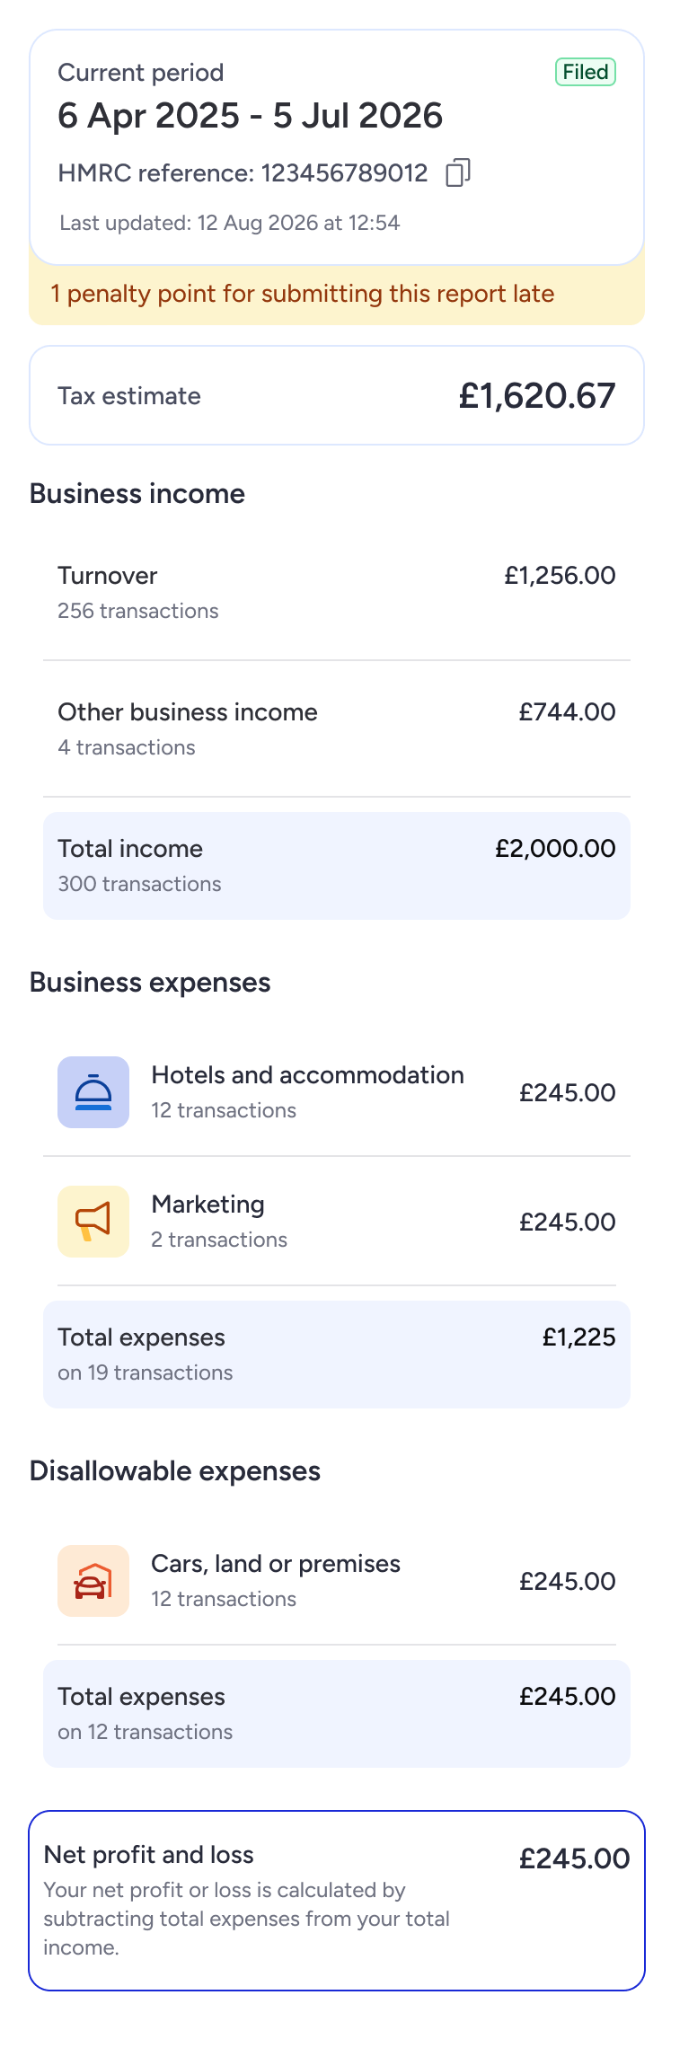
I worked with the product designer to put the figures in calculation order, using minus and equals symbols to show how they related. We also made the connection between net profit and the tax estimate explicit.
Members expressed greater confidence in this version. We’d changed several things together, though, so we couldn’t say which change had helped most. We also hadn’t tested whether that confidence came with a better understanding of the calculation.
04
Knowing when an update was complete
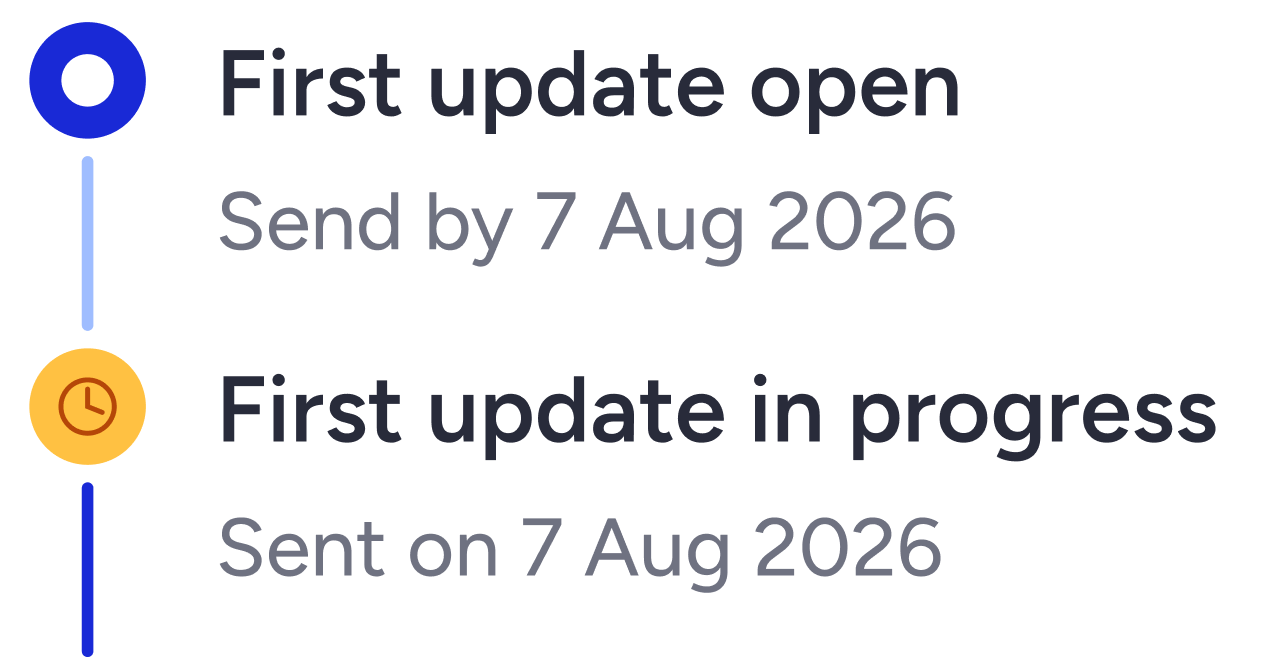
During discussions with engineering, I found that HMRC confirmation could take around 15 minutes.
That mattered for the status we showed. If we said “Complete” while Tide was still waiting for confirmation, members could reasonably think everything had gone through.
I changed the interim status to “In progress” and kept “Complete” for when we had confirmation.
The component only allowed a status label, so there was a limit to what I could explain. The wording reflected what we knew, but it still left members without an explanation of how long they might wait.

05
Working through the things that could go wrong
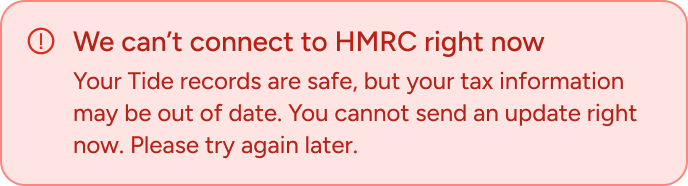
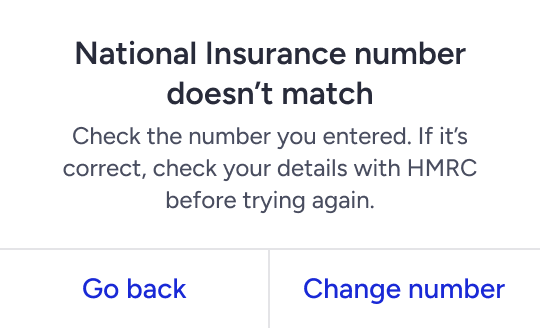
Different problems needed different next steps. A service being unavailable called for different guidance from a mismatch in someone’s information.
I worked with engineering and operations to understand these cases and give members a useful way forward. Tax specialists helped clarify warnings and income the product didn’t support.
The content explained where members were in the process, what had stopped them and what they could do next.
06
Making the paid option clear
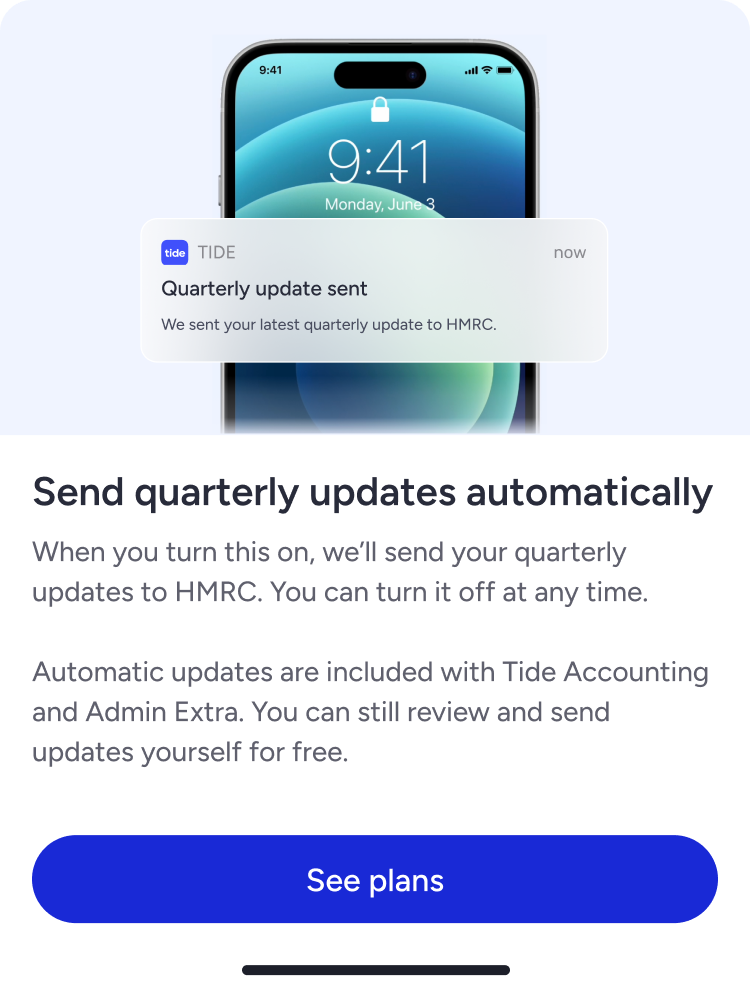
Tide also offered paid automatic updates. I worked with product and commercial colleagues to explain that option while keeping the free self-service route clear.
Members needed to understand that they could send quarterly updates for free and choose to pay for automation. I used “See plans” because the next step took them to a wider plan comparison.
07
The results
Of the 1,160 members who started setup, 924 completed it: around 80%. These were results for the product as a whole. We didn’t measure content’s contribution separately.
The submission report also recorded 600 businesses, but successful submissions and compatible cohorts still needed verification. I haven’t used this as a submission conversion rate.
The research gave us more specific evidence about the calculation: members felt more confident after we made it explicit. I’d want a separate check of their understanding before drawing a stronger conclusion.
08
What I’d do differently
I’d involve engineering earlier to understand delays, confirmations and failures before we settled on the interface. The wait for HMRC confirmation showed how much those details could change the content.
I’d also establish what members needed to know before working within the component limits. In this case, the status label couldn’t explain the wait on its own.
And I’d test confidence and understanding separately. Both mattered here, and we needed evidence of each.